Everything You Need to Know About Graph Databases & Neo4j
Understanding graph databases - key concepts and benefits
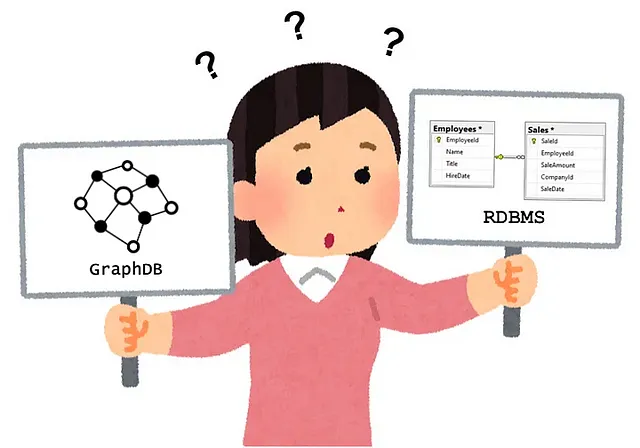
Storing and processing data is an elementary task of software engineering. In the early days of large-scale professional development, relational databases such as Oracle, IBM DB2 and SQL were dominant. Data manipulation systems cannot easily work with structural or relational data, but only with flat data representations. [1] Graph databases try to bridge the gap between relational and flat data representations, while making it easier to access information. [2] The most popular representative of this type of database is Neo4j. [3]
Name: Neo4j
Software Type: Graph Database (GDB)
Initial Release: 2007
Origin: Neo4j, Inc.
Target Platform: Cross-Platform, e.g. Windows, Linux, ..
Languages: Implemented in Java and Scala, Web-Tools in Typescript, Cloud functionalities in Go
Website: https://neo4j.com/
Introduction
Transactions of all types in today’s world are becoming increasingly digitally dependent. That is, because there is a significant rise in the usage of cards and e-payment methods in most countries (e.g., Germany). [4] As transactions become more digital, indicators such as IC3 complaint statistics hint that digital criminal activities are increasing as well. [10] TransUnion for example, a vendor for payment processing software, reported a global 149% increase in digital fraud attempts. [5]
Without using graph databases, the transactions and relationships of people involved in such activities need to be modeled in a relational way. But, it is substantially easier to model and access relationship data if it is modeled in a more suitable type of database — a graph database.
Let’s dive into some example to see where graph databases come in handy.
Example 1 — Uncovering the Panama Papers ⚖️
![The Panama Papers Neo4j database data model. [13] (Photo by the author)](/assets/images/1_0OD4ke8HaP0zw3HEMMdPPg-b982d7988fd31d803580de737d11a604.webp)
In the year 2016, gigantic quantities of documents were leaked to German journalist Bastian Obermayer from the newspaper Süddeutsche Zeitung. [6]
The documents leaked contain clues for tax evasion and money laundry on a scale never seen before. The leak is made up of 2.6 terabytes of data, consisting of 11.5 million individual documents. [7]
In order to process and investigate data that is mainly made of relational data between business actors, a graph-based approach is obvious. Mentioned people and companies can serve as 1) nodes while the type and properties of the relationships serve as 2) edges. In the feature image of this section, you see how the Panama Papers were modeled in Neo4j.
In order to process and investigate data that is mainly made of relational data between business actors, a graph-based approach is obvious. Mentioned people and companies can serve as 1) nodes while the type and properties of the relationships serve as 2) edges. In the feature image of this section, you see how the Panama Papers were modeled in Neo4j.
Example 2 — Property Management ️🛫️
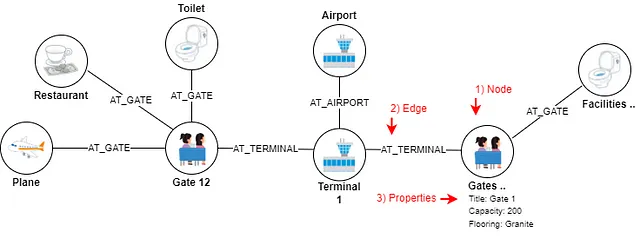
As someone who has spent too much time in an airport can attest, there are countless objects with relationships to each other present at an airport.
From planes to terminals to gates and restaurants, each element of the airport is interconnected and relies on a multitude of relationships to function smoothly.
That’s what the graph database can support. By mapping out the airport, terminals, planes, restaurants, and more as nodes on a graph, and their relationships as edges, property managers can gain a deeper understanding of the airport’s operations.
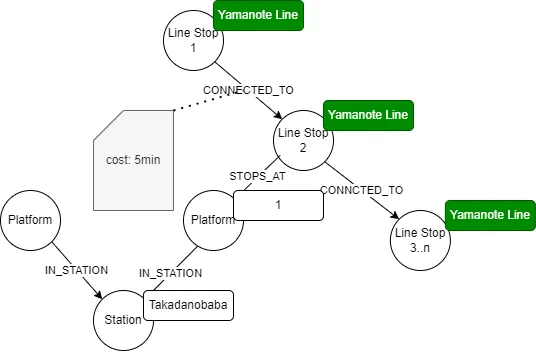
Example 3 — Train Operations at JR East 🚆
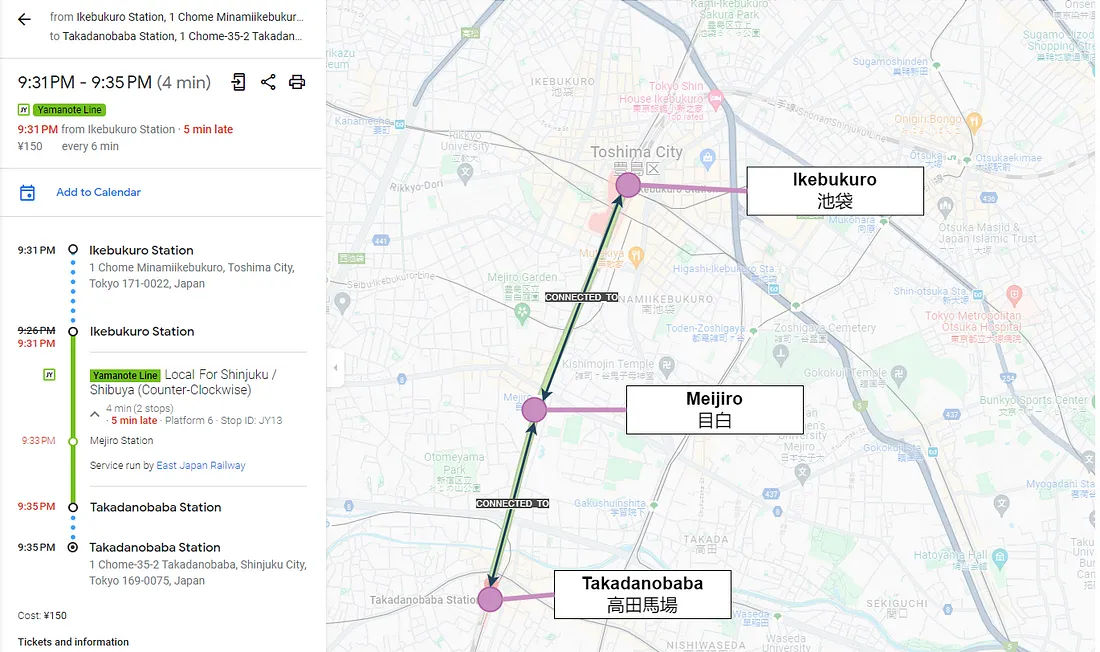
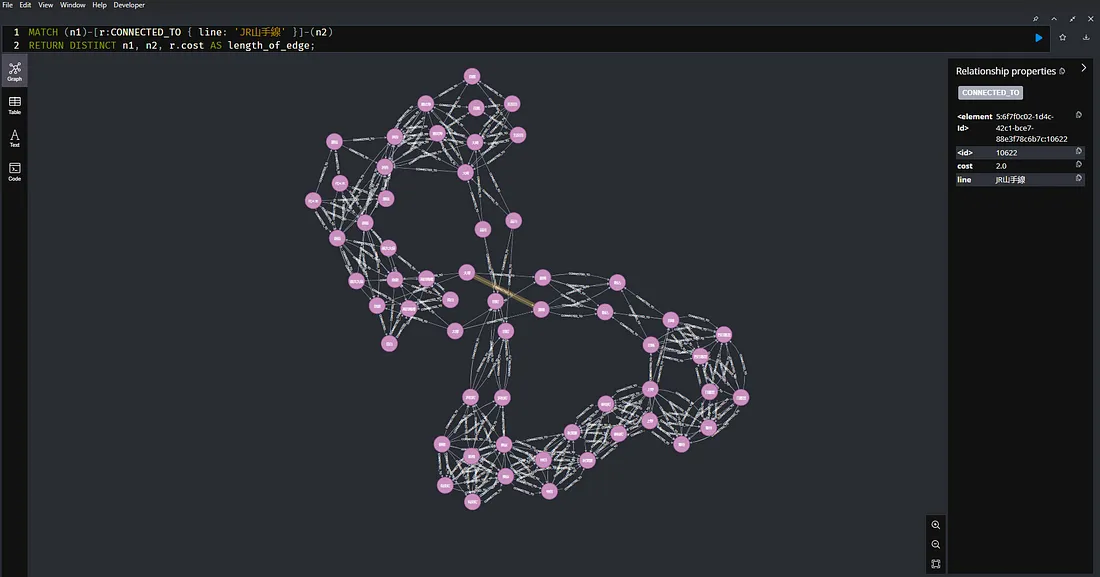
![The result of our Cypher query against the example of Tokyo public transport. [14] (Photo by the author)](/assets/images/1_824anor8T4GbwpaJ6QBlNw-041a7c2b6477bab3f7f92c26b4acdbc0.webp)
Public Transport involves many different objects, like stations and platforms, that have connections with each other.
These connections can have extra details, like the time it takes to travel from one point to another in a public transport network.
An example of this kind of network is the train lines and stations in Tokyo. When we load them into Neo4j, we can run queries in its query language, called Cypher to gather information about these objects and their connections. [14]
MATCH (source:Station {name: '高田馬場'}), (destination:Station {name: '池袋'})
MATCH path = shortestPath((source)-[r*]-(destination))
RETURN path,
  reduce(cost = 0, rel in relationships(path) |
    cost + coalesce(rel.cost, 0)) AS total_cost LIMIT 1
The feature picture in this section shows the outcome of our query. To check if our results are correct, I used Google Maps to calculate the route, and to my surprise, the outcome was the same as the one retrieved with Cypher. It must be easy to implement route optimization algorithms with Neo4j.
If you want to give it a try yourself, I have forked the original repository and included the Cypher file with my request. For the best experience with this example, it is recommended that you have some basic knowledge of Japanese. Enjoy! 🤗
Uri: https://github.com/martinjurran/neo4j-train-route-sample
Alternatives to Graph Databases
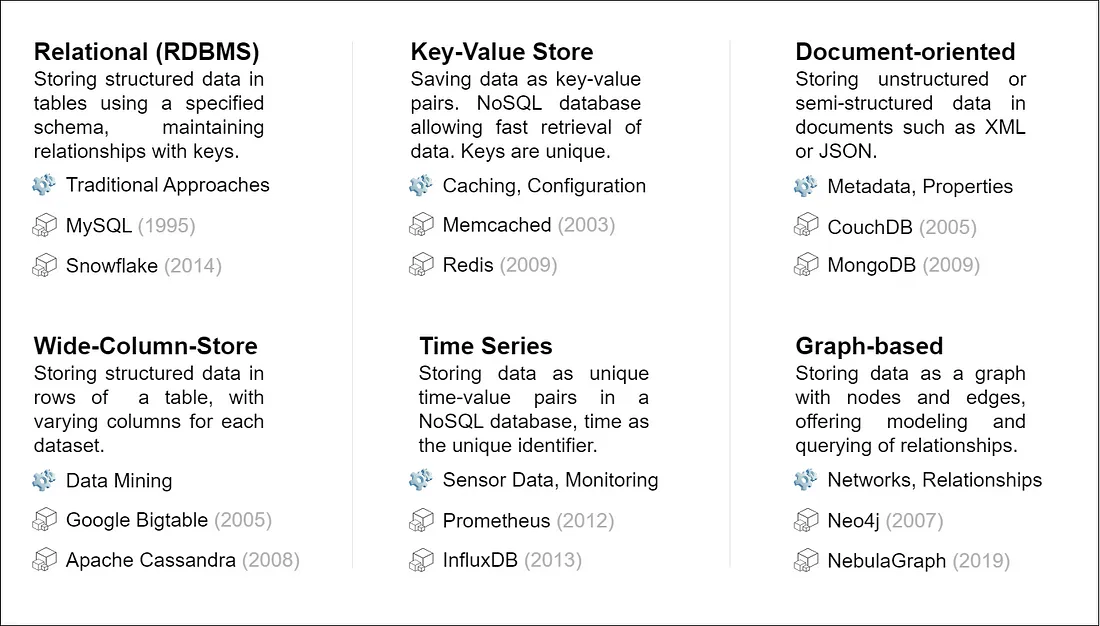
There are lots of scenarios that can be displayed with graphs. These data could also be stored in relational databases — tables per object type with foreign keys modeling their relations to other objects. The data processing could then be implemented with Joins in SQL-Queries. With the trend towards using NoSQL-solutions [8], it became more acceptable to use database variants besides SQL depending on the specific use case.
If you’re wondering if a graph database is the right choice for you, take a look at this overview:
The Graph Database Neo4j
The first and probably the most famous representative of graph databases is Neo4j. The name was intended to be NeoDB, but NeoDB.com was already taken at launch time, so the team decided to name the application Neo4j.
- The word Neo is the Latin word for new, which is inspired by the character Neo in the movie Matrix. [19]
- 4j means “for Java”. [8, 9]
Today, Neo4j is not a Java embedded application anymore, but a piece of history remains in its name.
History of Neo4j
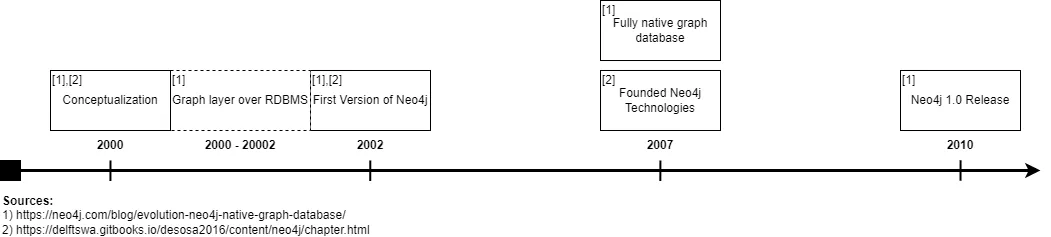
2000: Conceptualization. The founders were bothered by a Content Management System (CMS), which was based on a relational database (RDMBS) called Informix. [15]. Implementing their use cases within the CMS resulted in writing a lot of complicated SQL queries, which became increasingly hard to maintain.
The founders thought of their data as being connected to each other, one of paths between our related items of content, metadata, tags, and metatags for that content , which finally led to the development of the property graph model.
2000–2002: Graph layer over RDMBS. The first step was to write a graph layer on top of a relational database called Informix. [15]
2002: First Version of Neo4j. The graph layer on top of Informix presented some challenges. The issue was, that Informix wasn’t optimized to handle all the relationships between their graph-alike data. [15]
Faced with the challenge of using an RDBMS for connected data, the developers decided to create a new kind of database optimized for connected data. [15]
2007: Invention of the word graph database. The word graph database was invented by Emil Eifrem and is being based upon one of Facebook marketing statements that “we are a utility for the socialgraph”. He combined the words graph and database, and that’s how the word graph database was born. [16] [17]
2007: Founding of Neo4j Technologies. The company was founded, but was primarily involved in consulting, as there was no own product to sell yet. [17]
2007: Graph database became fully native. The prototype became a fully native graph database. [18] It started out as an embedded Java database. [8]
2010: Release of Neo4j 1.0. [18]
2011: Development of Cypher. The first ever declarative query language for property graphs has been created. [18] It is inspired by MS Visio’s placing objects and relationships on an UI and it is therefor a very human querying model. [8]
Over the time, Neo4j has evolved from a prototype drafted on a plane ride [21], into a standalone database application, satisfying its customers needs. These needs also reflect in the architecture of the solution, which is covered subsequently.
Stakeholders
To discover the architecture of Neo4j, it is important to understand the Stakeholders which might influence architectural decisions, as outlined by Rozanski and Woods. [20]
The following Power Interest Grid lists the application’s stakeholders and puts them into perspective to visualize their likelihood of influence on architectural decisions.
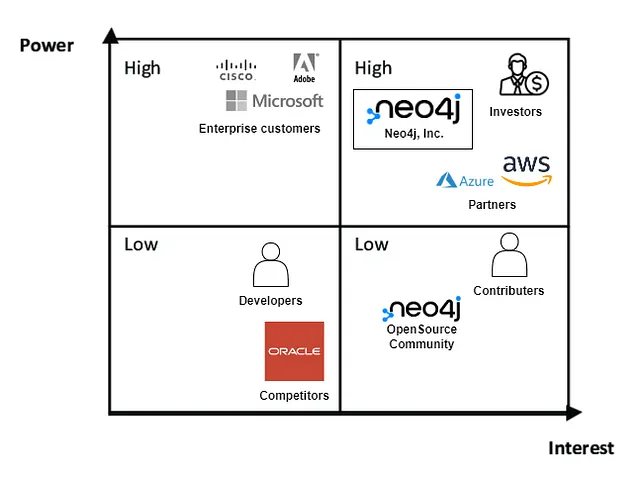
Those stakeholders with high levels of both power and interest, such as Neo4j investors [22], Neo4j Inc. themselves, and their partners [23], have significant influence over software architecture decisions. They need to be closely managed. [24]
While the needs and demands of enterprise customers are taken into account, their influence is relatively limited as they do not have the same level of investment in the software as other stakeholders. They need to stay satisfied. [24]
Competitors may influence Neo4j’s direction indirectly by challenging their market position. Developers usually have the stack set for their product and are not having enough power to influence Neo4j’s architecture individually. They shall be monitored. [24]
The open-source community and individual contributors, play an important role in shaping the conversation around the software architecture and discovering bugs. Still, they have limited influence. The right choice is to keep them informed. [24]
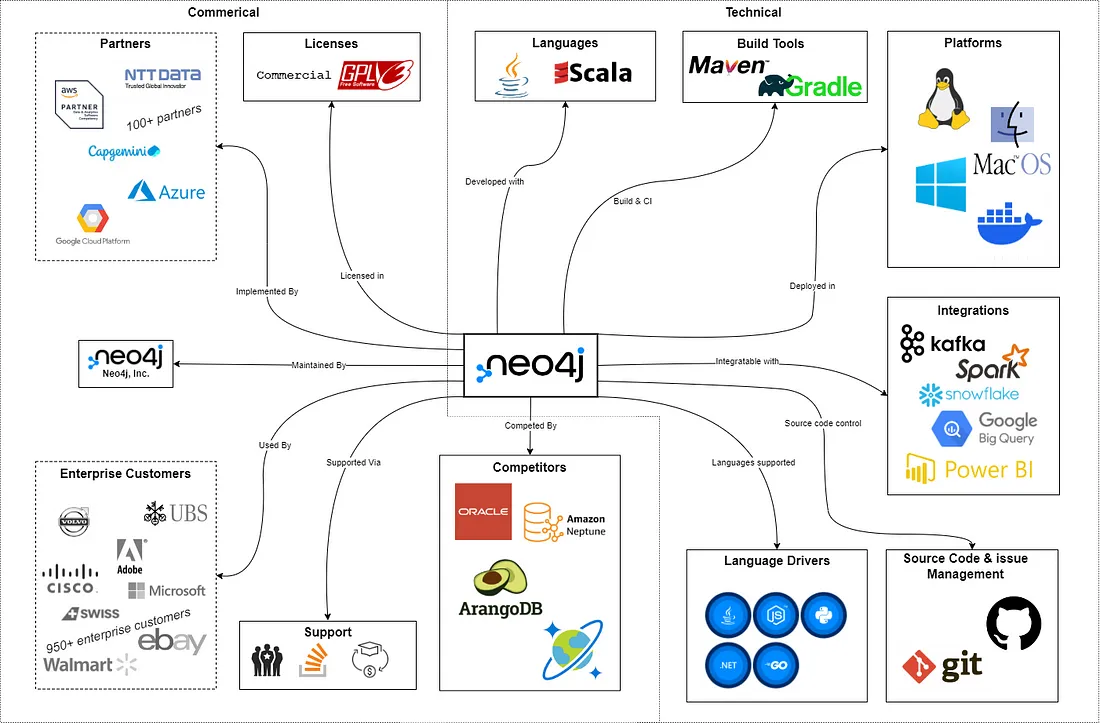
Dependencies
To better understand the architecture that Neo4j is based on, it is important to know its current dependencies and how they are shaping Neo4j into the solution it is now.
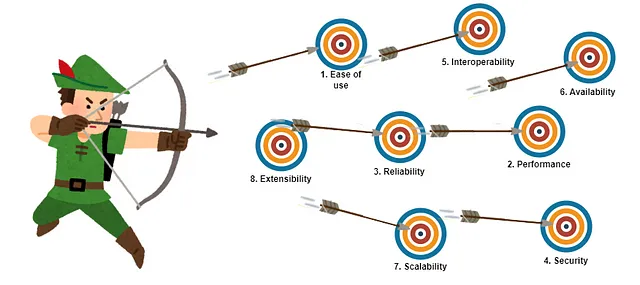
Architectural Goals
The table below presents the primary architectural goals of Neo4j, where the order depicts their importance. Now, let’s explore the various techniques used by the software to accomplish these goals.
-
🟢 Ease of use. It’s a standalone platform with graph-native data modeling, a user-friendly querying language called Cypher, and thorough developer documentation that’s easy to understand. That’s what’s making it easy to work with Neo4j and all the involved stakeholders are having a good experience. (Developer Perspective)
-
🟠 Performance. Neo4j is graph-native database that’s equipped with a variety of optimizations to ensure fast query response times for complex graph data. The platform also boasts high concurrency and consistency features. Additionally, graph algorithms are running very efficiently.
-
🔵 Reliability. It’s important for any database platform to be reliable. Neo4j is achieving that through ACID transactions, monitoring, event logging, TLS wire encryption, and permission systems.
-
🟣 Security. When data is involved, security is especially important. Neo4j’s achieves security through event logging, TLS wire encryption, fine-grained permission systems, and data-at-rest encryption.
-
🟡 Interoperability. Able to operate on all relevant target systems. Easily integrable into existing environments. A huge variety of clients for data access are supported.
-
🔴 Availability. Able to operate in clusters, which is increasing availability to meet enterprise demands.
-
🟤 Scalability. Scalable both horizontally and vertically to handle increasing amounts of data and query volume.
-
⚪ Extensibility. Both Neo4j development team and external community developers can easily extend the solution. That’s valid for both modifying existing components and adding new functionalities. Neo4j is open for new technological and methodical trends.
🟢 Ease of use
Most developers have at least a basic understanding of how relational databases work, but graph-based solutions are new to most. For Neo4j’s success, it is crucial that developers can adapt the solution quickly and build working products without any unnecessary barriers.
Supporting developers in their adaption is, that graph databases usually equal their concept data model. They are schema-free, like most NoSQL solutions. Data is being represented as nodes and edges.
Non-developers can explore data through the interactive Neo4j browser. This includes everything from initial ideas on a whiteboard to developing queries in the Cypher language, which is equivalent to SQL.
Neo4j’s ability to efficiently execute complicated queries with connections over many nodes and edges is mainly due to its dedicated graph data model. Relationships are directly materialized as a data structure in the database, allowing “pointers” to be traversed without many sub-queries and joins. Neo4j is not based on an existing database but is a highly specialized implementation.
🟠 Performance
Neo4j is a highly optimized, graph-native database, which is optimized to handle large scale graph operations. Graph queries are executed much faster and more efficiently, since all the related data is stored in one place and reflected as graphs.
Also, Neo4j implements several performance optimizations speficially implemented for graphs:
- B-trees for fast retrieval of nodes and edges in a graph dataset
- Indexing tailor-made for graph data with the option to define multiple indexed on one property
⚪ Extensibility
Neo4j offers official Bolt drivers for .NET, Java, JavaScript, Go, and Python. Community implementations are also available for C/C++ and PHP. Plus, it’s possible to access Neo4j’s database via its HTTP API regardless of the programming language you are using.
Sometimes developers need to extend the capabilities of the Neo4j database by creating their own procedures or functions. Neo4j has plugins and unmanaged server extensions for HTTP endpoints that allow for this. Documentation is available for implementation in JVM languages.
Neo4j provides many ways to extend its functionality and stay up-to-date with trends. Developers can use Bolt and HTTP access protocols through Cypher or create their own plugins to improve the Neo4j software.
Recent updates to Neo4j include GraphQL integration and connectors for popular streaming solutions like Kafka and Spark. Additionally, Neo4j offers a Graph Data Science library that provides various algorithms and machine learning modeling options to cover use cases related to data analytics and machine learning.
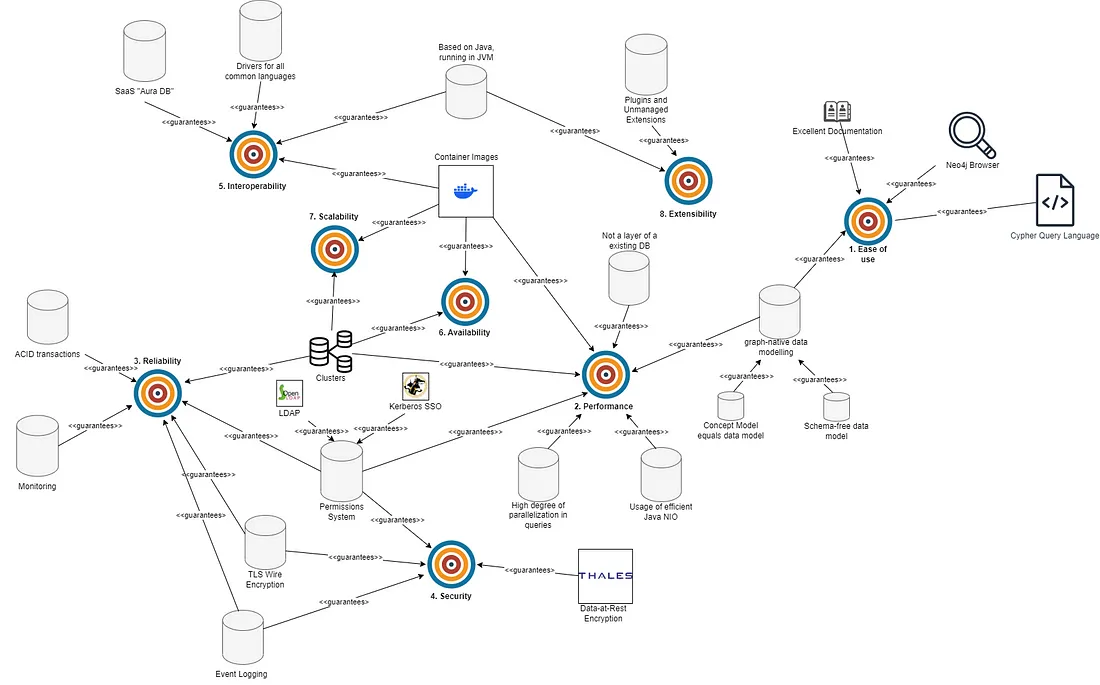
The Big Picture (🟢/🟠/🔵/🟣/🟡/🔴/🟤/⚪)
Now that we’ve explored some individual architectural goals and how Neo4j addresses them, let’s take a step back and visualize the big picture.
Imagine a graph of interconnected architectural goals, where each node represents a specific goal, such as data consistency or availability, and each relationship represents how those goals are related or dependent on each other:
Architectural Structure
To understand how Neo4j implements its architectural goals in general, we should look at the solution from a more technical perspective.
![Rough overview about a typical Neo4j setup [22] (Photo by the author)](/assets/images/1_ZQ-hfcGdpFWW_M1TZhFNpg-de9a4fb6aaa8954c9091ddeee03e1a83.webp)
Advantages of Neo4j for software architects
Now you have received all that information on graph databases and Neo4j. But, how can that help you? Utilizing a graph database can have immediate positive effects for you and your work:
- High performance for complex queries
- Greater flexibility in data modeling
- Ability to handle unstructured data
- Improved scalability and availability
- Easier integration with other technologies
- Greater business agility
Conclusion
Neo4j has gained recognition in modern software architecture due to its capabilities for handling graphs. But today, it is way more than the all-purpose-answer for handling graph data.
For today’s software architects, it is important to choose specialised databases for certain use cases, instead of building whole solutions based around one data backend. That is especially valid as microservice architecture still continues to be on the rise.
If you haven’t already, I personally encourage you to explore some test use cases to discover the power of graph databases and how they can benefit you. Whether it’s logistics, finance, healthcare, social media, or e-commerce, graph databases can provide insights that traditional databases cannot.
Sources
[1, 2] Silvescu, Adrian & Caragea, Doina & Atramentov, Anna. (2002). Graph Databases.
[3] DB-Engines Ranking of Graph DBMS 2024 https://db-engines.com/en/ranking/graph+dbms)
[4] Deutsche Bundesbank (2022, Juli 7). Payment behaviour in Germany in 2021. https://www.bundesbank.de/en/press/press-releases/payment-behaviour-in-germany-in-2021-894120
[5] Leonhardt, M. (2021, June 3). Online fraud attempts are up 25% in the US — here’s why. CNBC. https://www.cnbc.com/2021/06/03/why-online-fraud-attempts-are-up-25percent-in-the-us.html
[6] Clark, Nicola (April 5, 2016). “How a Cryptic Message, ‘Interested in Data?,’ Led to the Panama Papers”. The New York Times. ISSN 0362–4331. Archived from the original on August 15, 2016.
[7] “About the Panama Papers Investigations”. International Consortium of Investigative Journalists. January 31, 2018. Archived from the original on July 24, 2020.
[8] Emil Eifrem (2017 Jul 27), Hello, World: Neo4j, Inc. https://neo4j.com/blog/hello-world-neo4j-inc/
[9] Dr. Jim Webber (2022, June 8). A Personal History of Neo4j. Neo4j Inc. https://www.youtube.com/watch?v=YB723cp9jgM
[10] Federal Bureu of Investigation (2023). Internet Crime Report. https://www.ic3.gov/Media/PDF/AnnualReport/2023_IC3Report.pdf
[11] Gopala Kr (2017). Neo4j Architecture. https://github.com/gopala-kr/10-weeks/blob/master/Projects-Blogs/07-bigdata-databases/neo4j-architecture.md
[12] Dr. Jim Webber (2017, May 2), The Engineering Evolution of Neo4j into a Native Graph Database. https://neo4j.com/blog/evolution-neo4j-native-graph-database/
[13] William Lyon (2018, December 3), Graph Visualization of Panama Papers Data in Neo4j, https://medium.com/neo4j/graph-visualization-of-panama-papers-data-in-neo4j-9c08ca17039c
[14] ggszk (2020), Neo4j sample database: Tokyo railway routes (in Japanese), https://github.com/ggszk/neo4j-train-route-sample
[15] Emil Eifrem (2016, Mar 29), DB-Engines, Informix and Neo4j: An Origins Story, https://neo4j.com/blog/db-engines-informix-neo4j/?ref=martin.jurran.org
[16] Emil Eifrem (Unknown), The birth of graph databases: How Neo4j built its product and category, https://neo4j.com/news/birth-graph-databases-neo4j-built-product-category/
[17] Alastair Dryburgh (2007, Mar 22), Growth Stories: The magical power of a name, https://www.forbes.com/sites/alastairdryburgh/2017/03/22/growth-stories-the-magical-power-of-a-name/#49b4ebe56db9
[18] Neo4j Inc, The History of Neo4j — Open Source, Big Community, https://neo4j.com/open-source-project/
[19] Emil Eifrem (2016, Mar 22), Twitter Post, https://twitter.com/emileifrem/status/712327903032188928
[20] Rozanski, Nick, and Eóin Woods. Software systems architecture: working with stakeholders using viewpoints and perspectives. Addison-Wesley, 2012.
[21] Emil Eifrem, (2022, August 8), The first code of this database was written in IIT Bombay, https://www.youtube.com/watch?v=Nhi4XwmCh9A
[22] Crunchbase, Neo4j Profile, https://www.crunchbase.com/organization/neo-technology
[23] Neo4j Inc, Partner Directory, https://neo4j.com/partners/directory/
[24] Latha Thamma Reddi (2023, Apr 14), Stakeholder Analysis using the Power Interest Grid, https://www.projectmanagement.com/wikis/368897/stakeholder-analysis--using-the-power-interest-grid
Pictograms by かわいいフリー素材集 いらすとや (irasutoya.com), © Takashi Mifune
Comments